Tools for requirements management store and manage information about requirements. They allow testers to prioritize requirements and to follow their implementation status.
In a narrow sense, they are not testing tools, but they are very useful for defining a test based on requirements (see section 3.7.1) and for planning the test; for example, the test could be oriented on the implementation status of a requirement. For this purpose, requirements management tools are usually able to exchange information with test management tools.
Thus, it is possible to seamlessly interconnect requirements, tests, and test results. For every requirement the corresponding tests can be found and vice versa. The tools also help to find inconsistencies or holes in the requirements, and they can identify requirements without test cases; that is, requirements that otherwise might go untested.
Requirements and specification documents generally combine text, graphs, and special mathematical diagrams and symbols. The nature of the presentation depends on the particular style, method, or notation used. When measuring code or design size, you can identify atomic entities to count (lines, statements, bytes, classes, and methods, for example).
However, a requirements or specification document can consist of a mixture of text and diagrams. For example, a use case analysis may consist of a UML use case diagram along with a set of use case scenarios that may be expressed as either text or as UML activity diagrams. Because a requirements analysis often consists of a mix of document types, it is difficult to generate a single size measure.
EXAMPLE 8.10
There are obvious atomic elements in a variety of requirements and specification model types that can be counted:
i. Use case diagrams: Number of use cases, actors, and relationships of various types
ii. Use case: Number of scenarios, size of scenarios in terms of steps, or activity diagram model elements
iii. Domain model (expressed as a UML class diagram): Number of classes, abstract classes, interfaces, roles, operations, and attributes
iv. UML OCL specifications: Number of OCL expressions, OCL clauses
v. Alloy models: Number of alloy statements—signatures, facts, predicates, functions, and assertions (Jackson 2002)
vi. Data-flow diagrams used in structured analysis and design: Processes (bubbles nodes), external entities (box nodes), data-stores (line nodes) and data-flows (arcs)
vii. Algebraic specifications: Sorts, functions, operations, and axioms
viii. Z specifications: The various lines appearing in the specification, which form part of either a type declaration or a (non-conjunctive) predicate (Spivey 1993)
We can enforce comparability artificially by defining a page as an atomic entity, so that both text and diagrams are composed of a number of sequential pages. Thus, the number of pages measures length for arbitrary types of documentation and is frequently used in industry.
===========================================================================
EXAMPLE 1
Suppose P is a program produced to meet the following specification, S:
The inputs to the program are exam scores expressed as percentages. The outputs are comments, generated according to the following rules:
For scores under 45, the program outputs “fail”
For scores between 45 and 80 inclusive, the program outputs “pass”
For scores above 80, the program outputs “pass with distinction”
Any input other than a numeric value between 0 and 100 should produce the error message “invalid input”
A set of five test cases for P is
(40, “fail”)
(60, “pass”)
(90, “pass with distinction”)
(110, “invalid input”)
(fifty, “invalid input”)
Suppose that on input “40,” program P outputs “fail.” Then we say that P is correct on that input. If, for the input “110,” the program P outputs “pass with distinction,” then P fails on this input; the correct output should have been the error message “invalid input.”
The objective of a software testing strategy is to devise and run a set of test cases that satisfy or cover a set of test requirements. The test requirements are defined in terms of a software artifact or model of a software artifact, where an artifact may be the requirements, specification, design, program code, etc. These models are often graphs, for example, flowgraphs.
One testing strategy is to select test cases so that every program statement is executed at least once. This approach is called statement coverage—each statement is a test requirement. For deterministic software, each test case causes one test path through the program to execute. In terms of the program flowgraph, statement coverage is achieved by finding a set of test cases that execute test paths such that every flowgraph node lies on at least one test path.
EXAMPLE 2
Drawing 1 contains a program written to meet the specification S of Example 1. We can achieve 100% statement coverage for this program by choosing just two of the test cases: one with input “90,” and one with input “40.”
For “90,” the program executes the path <ABDEFG>.
For “40,” the program executes the path <ABCEG>.
Thus, C is covered in the second case, and all the other nodes are covered in the first case, so we have a complete statement coverage.
Another testing strategy is to select test cases so that every program branch is executed at least once. This approach, called branch (or edge) coverage, means finding test cases that cause the execution of a set of test paths such that every edge lies on at least one test path.
EXAMPLE 3
The set of test cases selected in Example 2 satisfies branch as well as statement coverage. However, this will not always be true. In the same program, the two paths ABCEFG and ABDEFG satisfy 100% statement coverage, but fail to cover the edge EG.
The most exhaustive structural testing strategy is to select test cases such that every possible test path is executed at least once. This approach is called complete path coverage. In terms of the program flowgraph, complete path coverage requires running every single test path through the flowgraph. This strategy, although appealing in theory, is normally impossible in practice. If the program has even a single loop, then complete path coverage can never be achieved because a loop gives rise to an infinite number of test paths.
There is another fundamental impediment to any structural testing strategy: infeasible paths. An infeasible path is a program path that cannot be executed for any input. In practice, infeasible paths can appear even in the simplest of programs.
EXAMPLE 9.20
In the program of Drawing 2, the path ABCEFG is infeasible. To see why, notice that node C is executed only when the score is less than 45, while node F is executed only when the score is more than 80. Thus, no input score can cause the program to execute both nodes C and F. The existence of infeasible paths can mean that, in practice, we may not be able to achieve 100% coverage for any structural testing strategy (even statement coverage).
Numerous other structural testing strategies have been proposed. In particular, researchers have tried to define strategies so that
1. They are more comprehensive than statement and branch coverage (in the sense of requiring more test cases).
2. The number of test cases required is finite even when there are loops.
Several of these strategies make use of the notion of simple paths and prime paths. They define a simple path as a path that does not contain the same node more than once except for the first and last node. A prime path is a simple path that “does not appear as a proper subpath of any other simple path.”
Examples:
• Edge-pair coverage: Testing “each reachable path of length up to 2” in the flowgraph.
• Simple-round-trip coverage: Testing “at least one round-trip path for each reachable node in” the flowgraph “that begins and ends a round-trip path,” where a round-trip path is a prime path that starts and ends at the same node. This requires every cycle through a loop to be tested, but does require branch coverage or all cycles through loops that contain decisions.
• Prime path coverage: Testing all prime paths in the flowgraph. This requires testing all cycles that start at reachable nodes, and, depending on the branches inside a loop, requires testing execution paths that cause a loop to cycle two or more times. Prime path coverage satisfies branch coverage, and requires a finite number of tests.
We have already noted one problem with structural testing strategies (namely, infeasible paths). In practice, there are two further important obstacles:
1. No structural strategy on its own (even 100% complete path coverage when feasible) can guarantee adequate software testing. Consider, for example, the program in Illustration 1, which implements the specification in Example 1. The path ABDEFG correctly outputs “distinction” when the input is “90.” However, the correct output for one execution does not mean that every execution of the path ABDEFG is correct. For instance, the input score “110” also executes the path ABDEFG, but the program wrongly outputs “pass with distinction” when it should be producing “invalid input.”
2. Knowing the set of paths that satisfies a particular strategy does not tell you how to create test cases to match the paths. This problem is undecidable in general—no automated method is guaranteed to either find the appropriate test cases or determine that such data does not exist; however, some commercial testing tools provide assistance.
2 Test Effectiveness Ratio
For a given program and a set of cases to test it, we would like to know the extent to which the test cases satisfy a particular testing strategy.
EXAMPLE 2.1
Suppose we are testing the program in Illustration 1, and we have run two test cases with input scores “60” and “90.” The test cases traverse two paths, ABDEG and ABDEFG, covering 6 of the 7 statements, 7 of the 9 edges, and 2 of the 4 paths in the program. Thus, we say that statement coverage is 86%, branch coverage is 78%, and path coverage is 50%.
We can define these percentages formally. Let C be a testing criterion that requires us to cover a class of test requirements (such as paths, simple paths, linearly independent paths, LCSAJs, edges, or statements). For a given program and set of test cases, the test effectiveness ratio (TERC ) is defined as
TERC = (Number of C requirements executed at least once) / (Total number of t est requirements for criterion C)
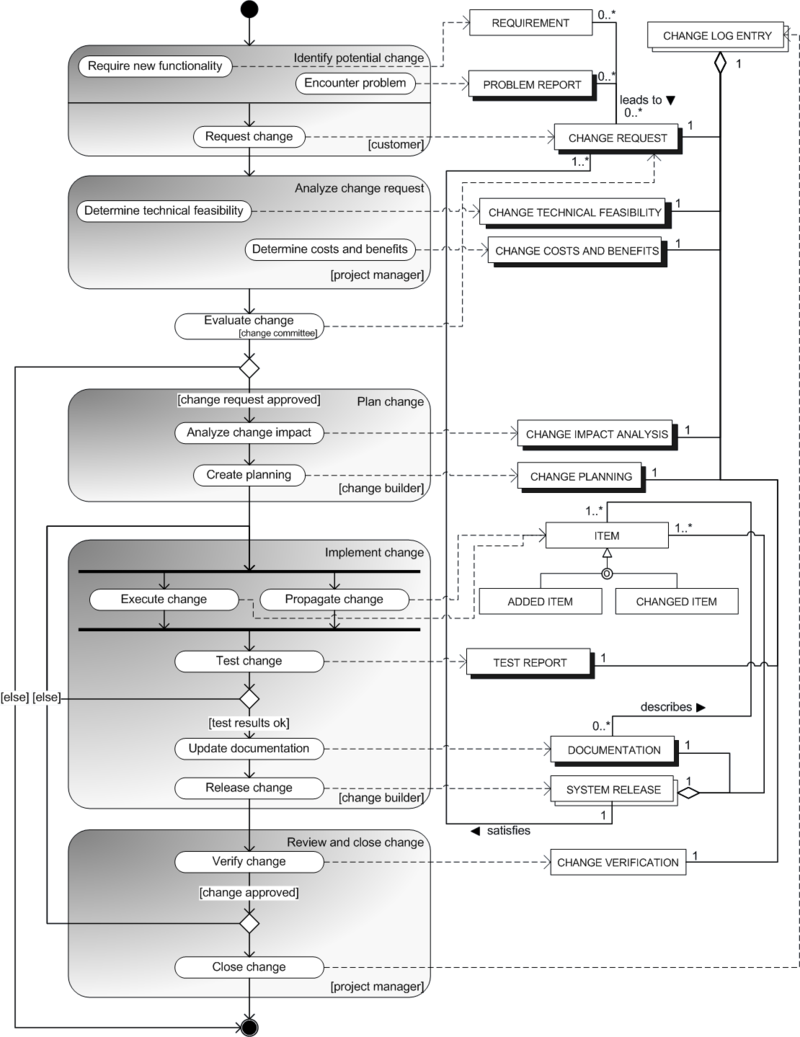
A change request is a document containing a call for an adjustment of a system; it is of great importance in the change management process.

Illustration
1: Change request
A change request is declarative, i.e. it states what needs to be accomplished, but leaves out how the change should be carried out. Important elements of a change request are an ID, the customer (ID), the deadline (if applicable), an indication whether the change is required or optional, the change type (often chosen from a domain-specific ontology) and a change abstract, which is a piece of narrative. An example of a change request can be found in Illustration 1 on the right.
Change requests typically originate from one of five sources:
problem reports that identify bugs that must be fixed, which forms the most common source
system enhancement requests from users
events in the development of other systems
changes in underlying structure and or standards (e.g. in software development this could be a new operating system)
demands from senior management
Additionally, in Project Management, change requests may also originate from an unclear understanding of the goals and the objectives of the project.
Change Request metrics
Use Change Request metrics to monitor and control the rate of change to application software.
Method
Prepare a management summary of the Change Requests, (CRs) which have been raised and/or processed, using a graphical means to present the information, where appropriate. The monthly and quarterly reports identified below are representative of those that can be prepared.
Monthly
The following reports are generally appropriate for monthly assessment of the maintenance process.
Change Request Status Report
Identify the number of CRs compared to previous time periods:
· by sub-category,
· by logged status.
Outstanding Backlog
Identify the estimated effort outstanding (this represents work backlog) compared to previous time periods for pending and in-progress CRs:
· CRs not started (i.e., statuses = change identified, cost/ramifications defined, benefits defined, approved by customer, approved by company),
· CRs in progress (i.e., status release assigned; use the project's time reporting system to determine the actual effort spent to date for the release compared with total estimated effort of all CRs assigned to the release).
Effort and Cost Expended on Change Requests by System
Identify the number of CRs compared to previous time periods:
· by system,
· by total effort logged (use the project's time reporting data for actuals).
This report can also present monetary values instead of effort.
It is necessary to allocate costs to each system relative to effort.
Quarterly Reports
The following reports are generally appropriate for quarterly assessment of the maintenance process.
Change Requests Processed by System
Identify the number of CRs compared to previous time periods:
· by system,
· by source of change,
· by priority.
This report may indicate which systems need re-engineering.
Cost Benefit Analysis of Changes
Identify the number of pending CRs:
· by benefit class,
· by total benefits and total costs.
This report also shows backlog but can be used for longer term analysis of priorities.
Effort and Cost Expended on Change Requests by Stage/Activity
Identify the total effort expended on CRs:
· by stage/activity,
· by application system/sub-system.
This information is useful in determining where effort is being expended on systems development and helps improve estimating.
Delivery of Releases On-Time and Late Deliveries
Provide a chart showing the number of actual releases over the past year and the percentage of releases which were delivered ahead of schedule, on schedule, or late.
Requirements rarely stay unchanged. Change requests come from the clients (requesting added functionality, a new report, or a report in a different format, for example) or from the developers (infeasibility, difficulty in implementing, etc.).
Change request frequency can be used as a metric to assess the stability of the requirements and how many changes in requirements to expect during the later stages.
Many organizations have formal methods for requesting and incorporating changes in requirements. Change data can be easily extracted from these formal change approval procedures. The frequency of changes can also be plotted against time. For most projects, the frequency decreases with time. This is to be expected; most of the changes will occur early, when the requirements are being analyzed and understood. During the later phases, requests for changes should decrease.
For a project, if the change requests are not decreasing with time, it could mean that the requirements analysis has not been done properly. Frequency of change requests can also be used to "freeze" the requirements—when the frequency goes below an acceptable threshold, the requirements can be considered frozen and the design can proceed. The threshold has to be determined based on experience and historical data.
Scenario One: You just heard from marketing that a critical business requirement needs to change and be accounted for in the upcoming release. You need to know how this change will impact work downstream and how the system specification your engineers are working with will change. Immediately.
Scenario Two: Your QA team just found a critical bug in your most anticipated new feature and you’re two weeks away from launch. Do you ship with the known bug and hope to patch it later, or delay the launch? Will this impact your upcoming audit? You need to know who is working on this feature, who else needs to be notified and weigh in on the decision, and know what other aspects of the product may be impacted. Immediately.
These scenarios, and countless others like them, affect engineering teams every day. And as software, embedded systems and external sensors contribute to product complexity (not to mention the complications that arise when you’re trying to unify multiple teams that contribute to a product) there is no chance that manual processes and static documentation can scale to support accurate impact analysis and quick decision-making. Requirements may be recorded, but if they’re not in a system of action, in situations like those above, you cannot effectively manage.
Gartner highlights one of the main reasons companies struggle to achieve the benefits of traceability:
“The most widely adopted tools for requirements continue to be general document software such as Microsoft Office or Google Docs (40% to 50% of the market) due to cost, availability and familiarity. Yet these often lead to poorly managed requirements, thus eliminating and exceeding any cost benefit the tools themselves have. Requirements end up captured in a variety of documents and spreadsheets supplemented by post-it notes in unmanaged versions with no traceability or reuse. This creates a more costly user acceptance testing cycle, both in the time to execute as well as remediation of issues found late in the process, where they are far more costly to address.”
— Gartner Market Guide for Software Requirements Definition and Management Solutions 2014
Software and hardware teams have to work together, in tight collaboration, which is difficult when they use different tools, use different terminology, and work in different cadences with difference methodologies. All details such as marketing requirements, functional requirements, test cases and other items that define the scope of what you’re building are related in some fashion, either directly or indirectly. Best practices for requirements traceability in complex products requires methods and tools that connect requirements to the upstream and downstream artifacts and testing, with verifiable coverage to prove compliance with internal controls and external regulations.
Your organization can adopt these four best practices around modern requirements management and requirements traceability to ensure product quality, decrease time-to-market and achieve regulatory compliance.
1. Connect stakeholders and contributors to the requirements they care about to ensure the right people can weigh in on important decisions at the right time.
Traceable relationships are as much about connecting the people as they are about connecting the requirements themselves. Each requirement in the system has members of the team associated with it—analysts, architects, development, verification and quality assurance among them—and stakeholders and customers who care about its status. With connected relationships built into your project you can quickly get interested parties involved in decision-making on short notice.
2. Automate bi-directional requirements traceability to minimize risk and ensure quality.
Manually updating an old-style traceability matrix is not only cumbersome and time consuming, it leaves open the risk for human error. In the development of safety-critical products like medical devices and airplanes, this risk isn’t acceptable. And it’s difficult to prove to an auditor that you got it right.
Key to managing requirements traceability is the ability to view source requirements and their related items downstream to lower-level requirements and then back to the source, and know the status of those items at each step of the product development process. And because this data may be stored in multiple systems, it’s key to be able to connect tools via open APIs and automatically pull data into a single actionable system with visualized coverage of these trace relationships.
3. Connect data, conversations and decisions in a single system in the product development process.
Being able to visualize coverage of trace relationships is imperative. But what happens when you find a gap, or a test is failing? The ability to confer and collaborate with the people connected to the requirement right in the system allows you to capture decisions and actions and keep that information associated with the requirement. Down the road, if you need to revisit decisions, all data is stored and easy to find.
With this managers can, for example, verify that their requirements are connected to downstream test cases and see what percentage of those tests have passed. In a system of action, every test case has a comment and activity stream accessible to all users. Testers and contributors can capture decisions, answer questions and resolve issues transparently and responsively.
4. Conduct formal reviews in compliance with internal controls or industry regulations with built-in reporting.
In the case of proving compliance with a set of rules and regulations you need to show your requirements, their traceable connections to test plans, and verification that all test have passed. Using a requirements management tool that has built-in formal reviews and reporting for auditors makes this process less cumbersome and more reliable.
Summary
The main goal of the requirements phase is to produce the software requirements specification (SRS), which accurately captures the client's requirements and which forms the basis of software development and validation.
The basic reason for the difficulty in specifying software requirements comes from the fact that there are three interested parties—the client, the end users, and the software developer. The requirements document has to be such that the client and users can understand it easily and the developers can use it as a basis for software development. Due to the diverse parties involved in software requirements specification, a communication gap exists. This makes the task of requirements specification difficult. There are three basic activities in the requirements phase. The first is problem or requirement analysis. The goal of this activity is to understand such different aspects as the requirements of the problem, its context, and how it fits within the client's organization. The second activity is requirements specification, during which the understood problem is specified or written, producing the SRS. And the third activity is requirements validation, which is done to ensure that the requirements specified in the SRS are indeed what is desired.
There are three main approaches to analysis; unstructured approaches rely on interaction between the analyst, customer, and user to reveal all the requirements (which are then documented). The second is the modeling-oriented approach, in which a model of the problem is built based on the available information. The model is useful in determining if the understanding is correct and in ensuring that all the requirements have been determined.
Modeling may be function-oriented or object-oriented. The third approach is the prototyping approach in which a prototype is built to validate the correctness and completeness of requirements. To satisfy its goals, an SRS should possess characteristics like completeness, consistency, unambiguous, verifiable, modifiable, etc. A good SRS should specify all the functions the software needs to support, performance of the system, the design constraints that exist, and all the external interfaces.
One method for specifying the functional specifications that has become popular is the use case approach. With this approach the functionality of the system is specified through use cases, with each use case specifying the behavior of the system when a user interacts with it for achieving some goal. Each use case contains a normal scenario, as well as many exceptional scenarios, thereby providing the complete behavior of the system. Though use cases are meant for specification, as they are natural and story-like, by expressing them at different levels of abstraction they can also be used for problem analysis.
For validation, the most commonly used method is reviewing or inspecting the requirements. In requirements inspections, the team of reviewers also includes a representative of the client to ensure that all requirements are captured.
The main metric of interest for requirements is some quantification of system size, as it can be used to estimate the effort requirement of the project. The most commonly used size metric for requirements is the function points. The function point metric attempts to quantify the functionality of the system in terms of five parameters and their complexity levels which can be determined from the requirements of the system. Based on the count of these five parameters for different complexity levels, and the value of fourteen different environmental factors, the function point count for a system is obtained. The function point metric can be used for estimating the cost of the system.
1.Is it possible to have a system that can automatically verify completeness of an SRS document? Explain your answer.
2.Construct an example of an inconsistent (incomplete) SRS.
3.How can you specify the "maintainability" and "user friendliness" of a software system in quantitative terms?
4.For a complete and unambiguous response time requirement, the environmental factors on which the response time depends must be specified. Which factors should be considered, and what units should be chosen to specify them?
5.The basic goal of the requirements activity is to get an SRS that has some desirable properties. What is the role of modeling in developing such an SRS? List three major benefits that modeling provides, along with justifications, for achieving the basic goal.
6. Make a friend of yours as the client. Perform structured analysis and object-oriented analysis for the following:
(a) An electronic mail system.
(b) A simple student registration system.
(c) A system to analyze a person's diet.
(d) A system to manage recipes for a household.
(e) A system to fill tax forms for the current year tax laws.
7.Write the SRS for the restaurant example whose analysis is shown in the chapter.
8. Write the functional requirements for the restaurant example using use cases.
9. Develop a worksheet for calculating the function point for a given problem specification.
10.Compute the function points for the restaurant example (can use the worksheet).